
Even the worst investor can perform well
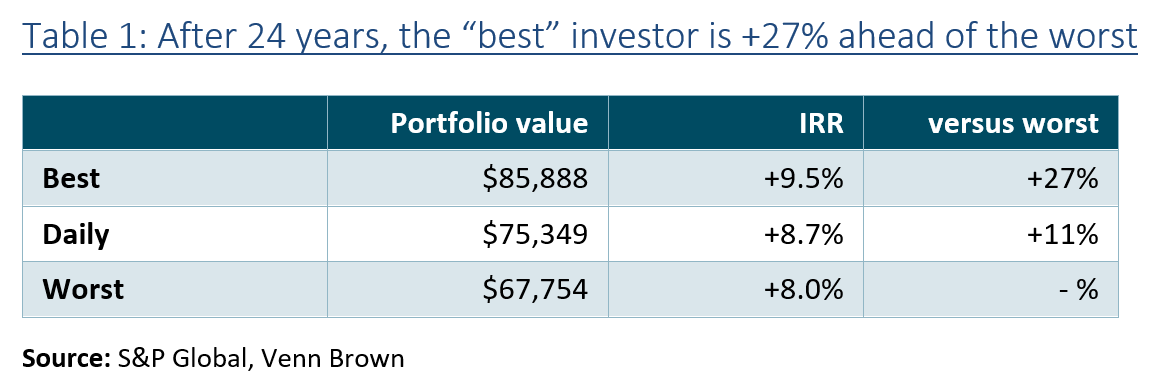
We modelled three investment strategies to measure the impactmarket timing has on long-term investment performance. The three investment strategies invested $1,000 annually into the ASX All Ordinaries Index from 2001 to 2024.
The Best strategy invested the full $1,000 on the day theindex reached the low point for the year. The Worst strategy invested the full $1,000 on the day the index reached its peak for the year. And the Daily strategy, invested the $1,000 spread evenly across every day the market was open throughout the year.
Over the period, each strategy invests a total of $24,000, with the best strategy outperforming the worst strategy by just +27%.
Even the worst strategy returned +8% per year
As shown in Table 1, the IIR for the worst strategy was 8.0% for the 24 years, compared to +9.5% for the best strategy and +8.7% for the daily strategy.
At the end of the period, the Best portfolio was worth$85,888, compared to the Worst, which totalled $67,754 (see Figure1).
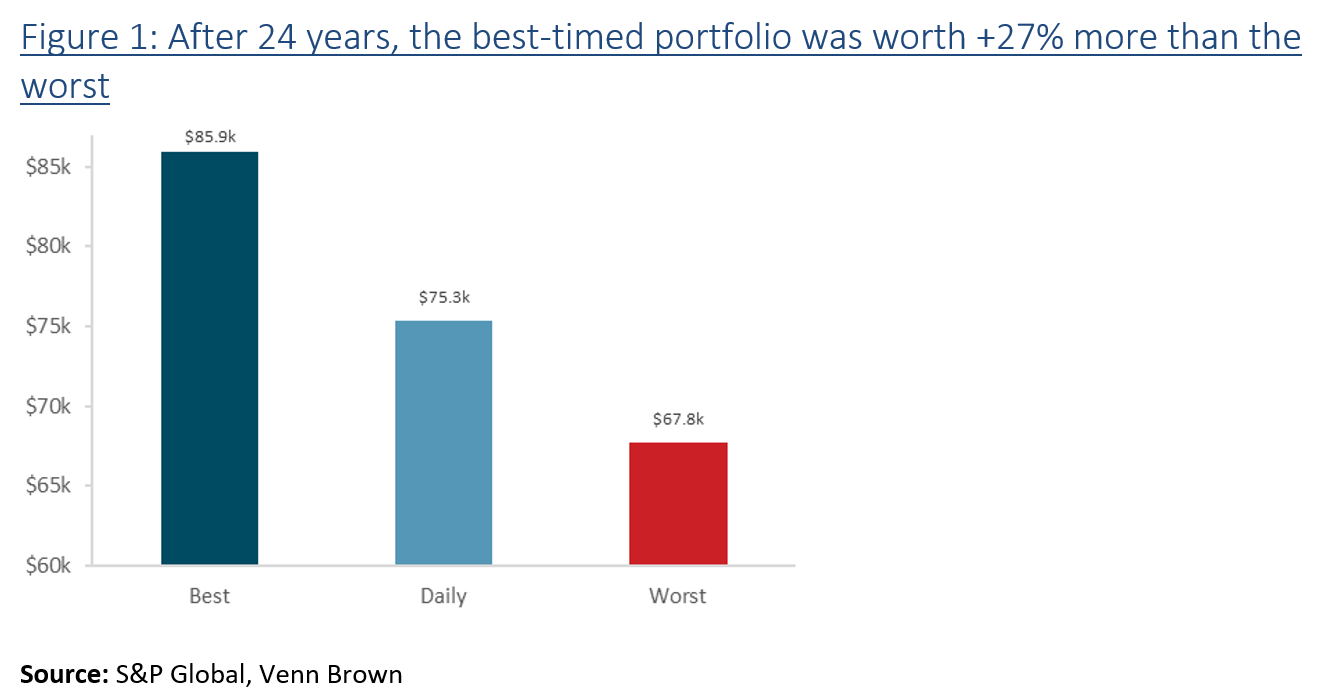
Figure 2 shows the performance of the three portfolios over the 24-year period. Interestingly,the performance gap between the Best and Worst steadily grew from +18% in thefirst year to 28% by 2008 (the 8th year). From 2008 onwards, the performance gap remained relatively steady, peaking at 31% in 2009, before reaching a steady 27% from 2016 onwards.
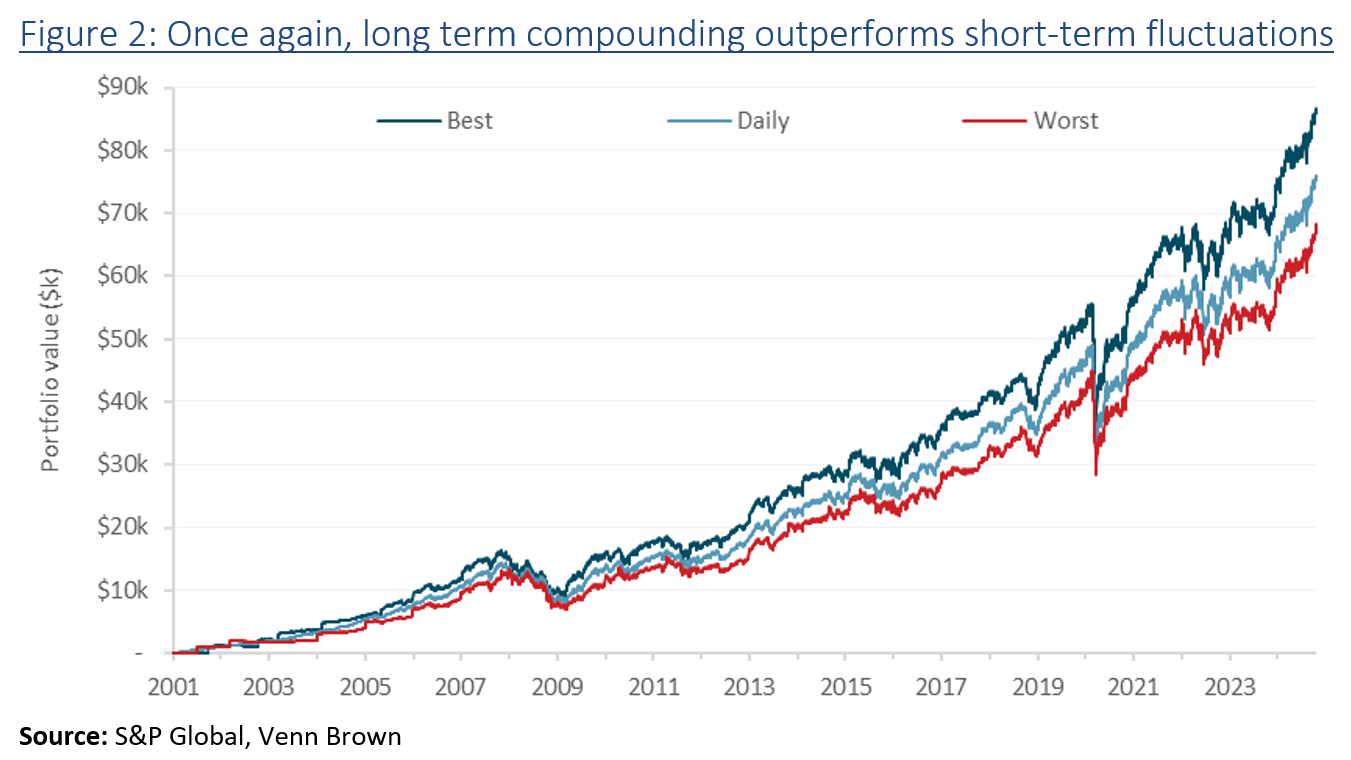
This surprising result illustrates that the long-termcompounding outweighs short-term fluctuations, even when the intra-year trough-to-peakgap ranged from 17% to 85%. Across the 24 years, the trough-to-peak averaged 27%,with a median of 19%.