
Bifurcation of large and small-cap markets
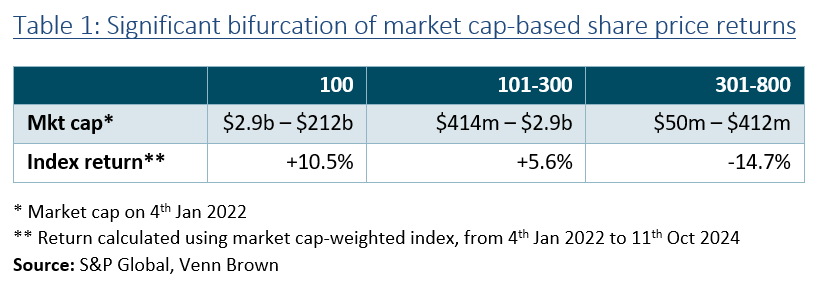
Since the beginning of 2022, there has been a complete bifurcation of the returns of large and small-cap segments of the ASX. We segmented the ASX based on market cap on the 4th January 2022. We did this rather than using an index as we wanted to remove any positive or negative impact from survivorship bias:
1. Large-cap: top 100 $2.9 billion to $212 billion
2. Small-mid cap: 101-300 $414 million to $2.9 billion
3. Micro-small cap: 301-800 $50 million to $412million
The top 100 is close to the ASX 100, while the small-mid cap is similar to the ASX small ordinaries.
On a market-weight basis (see Table 1),the top 100 companies have seen an overall price increase of +10.5%, comparedto a -14.7% decline in the value of the micro-small cap stocks.
Record highs hide the majority’s performance
While headlines keep reporting the market reaching all-time highs, these highs are being obtained by a small market subsegment, leaving behind most listed companies. Figure 1 shows market-weighted performance of each of the subsegments created for the three market cap segments outlined above. As is clear, the micro to small-cap portion of the ASX is well underperforming the large-cap segment.
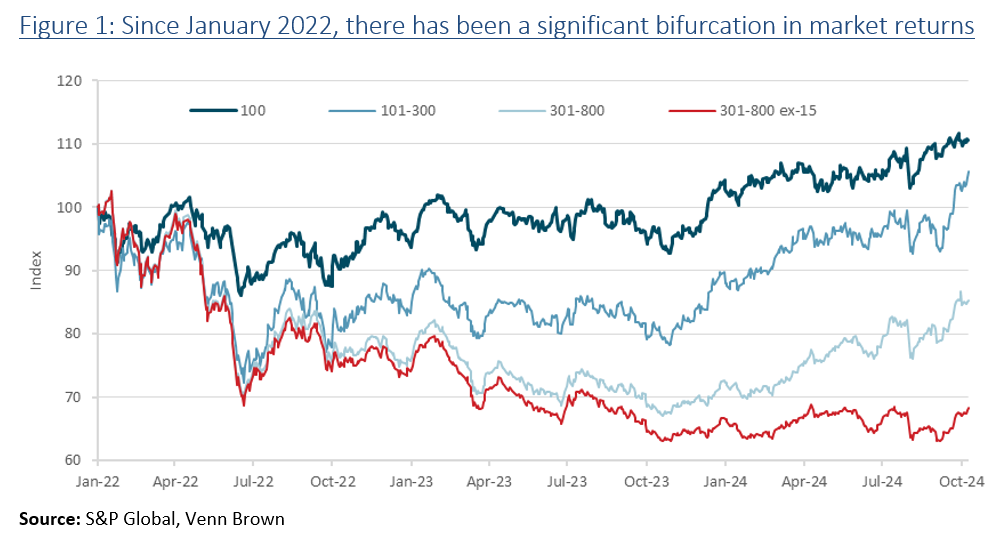
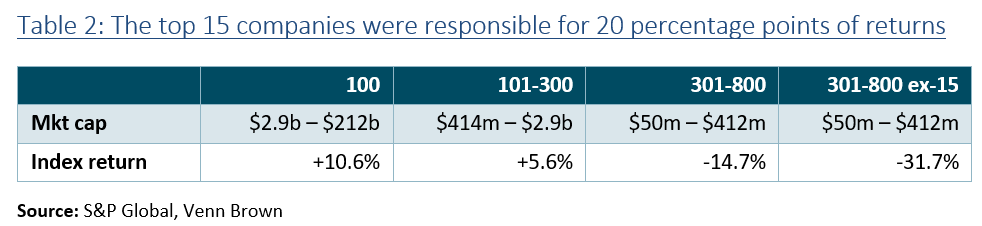
Incredibly, the triple digital returns of just 15 companies underpinned the performance of the micro to small cohort. If these 15 companies were removed (see red line), the remaining cohort would have been down -32% since the beginning of 2022.
The median return for micro-small cap companies since January 2022 is -51%
Instead of looking at the market-weighted returns[1], the drivers of this bifurcation emerge more clearly by looking at the equal-weighted returns of the different segments. We looked at the price change (accounting for new share issuances) of each individual company in each segment and took the average and median of these changes. This method treats the percentage movement of each company equally, irrespective of market cap.
As shown in Table 3, since January 2022, the average equal-weighted share price movement has ranged from +6% for the large-cap stocks, +4% for the small and mid-cap stocks and -5% for the micro and small-cap companies.
Probably more relevant is the median equal weighted change, which over the same period has seen micro to small-cap stocks decline -51%,compared to a median change in the large-cap stocks, which has seen a +1% uptick.
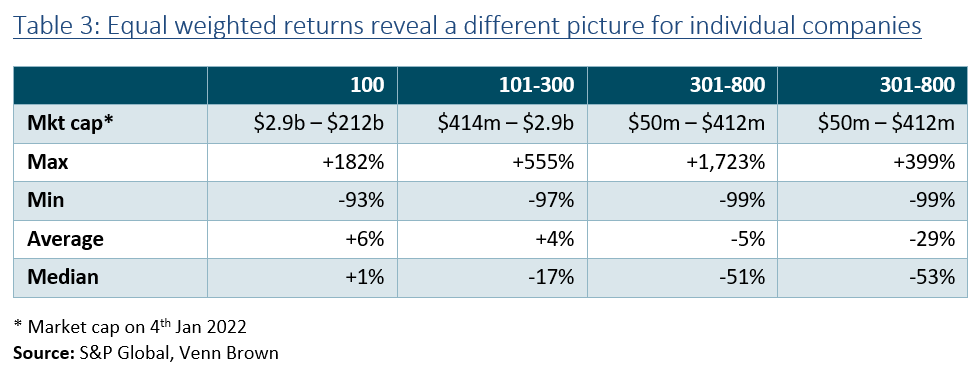
The sizeable difference between the average and medianvalues results from the large positive changes by a few stocks (mentioned above),offsetting the negative single and double-digit returns of most companies.
Table 4below shows the share of companies in each group that have delivered negativereturns since the beginning of 2022. At the micro-small cap end of thespectrum, 74% of all companies saw a decline in the market cap. In comparison,49% of large-cap companies have seen their share price decline.
Download the full report below...
[1]Average and median price changes are measured on an equity-weighted basis,without regard to market cap. They are calculated by calculating theaverage/median of percentage change of each company’s market cap since January2022.