
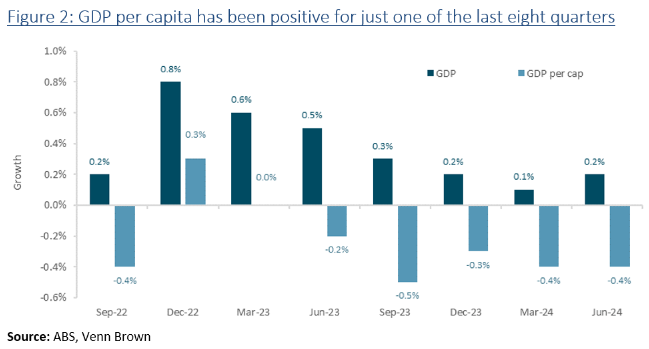
Fifth consecutive quarter of negative GDP per capita
We update our review of GDP and GDP per capita following Wednesday’sABS release of the June national accounts.
The June quarter was Australia’s fifth consecutive quarterof negative GDP per capita growth. Indeed, since September 2022, Australia has onlyrecorded one quarter of positive GDP per capital growth.
Immigration: continuing the GDP free kick, but forhow long?
One major flaw in the GDP measure that especially affectsAustralia is the free kick provided by population growth, which, in Australia’scase, means immigration.
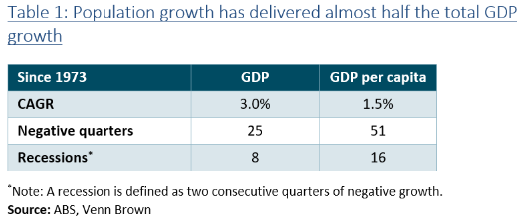
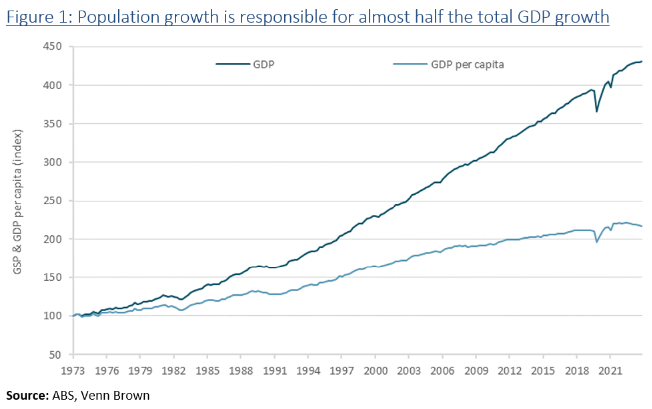
Looking back 50 years to 1973 (when the per-capita seriesstarts), population growth has provided 50% of the GDP growth, with GDP growingat a 3.0% compound average growth rate, compared to GDP per capita, which hasaveraged 1.5%.
GDP per capita has had double the negative quarters
Table 1 shows a similar pattern regarding the number ofnegative quarters and recessions (defined as two consecutive quarters ornegative growth). Since September 1973, GDP per capita has registered 51negative quarters compared to GDP, which recorded only 25 over the same period.
Immigration is the magic lever governments (of all colours)have become addicted to in order to boost GDP (and housing prices). If GDPlooks to be slowing, just let a few tens of thousands more people into thecountry and watch the GDP grow, although, with the growing discontent at theongoing housing crisis and the increasingly weaker GDP, the party might benearing an end with the June quarter GDP growth of 0.2%, albeit up from 0.1%recorded for the March quarter (see Figure2).
While all the talk is on cost of living and inflationpressure, it’s worth noting that while the government has been proudlyreporting unbroken economic growth, on a per capita basis, GDP has been flat ornegative for seven of the last eight quarters.
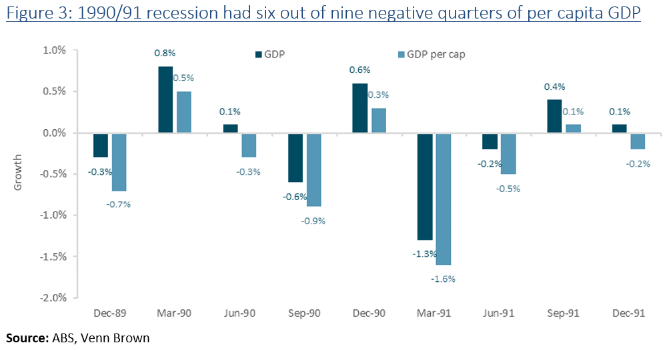
An interesting reference for the current period is the1990/91 recession (see Figure 3),during which per capita GDP was negative for six of nine quarters, compared toGDP, which was negative for four of the nine.
That’s not to say we’re even close to a similar economicdownturn. Back in 1990/91, there were three key differences to our currentenvironment, the most important of which is unemployment:
1) Seasonally adjusted unemployment peaked at 11.2%in December 1992, compared to today’s persistent, near-record low of 4.1% in July(albeit up from 3.5% in October – December 2022). See Figure 4;
2) Actual GDP was negative for three quarters, bottomingwith a -1.3% contraction; and
3) At the bottom, the magnitude of the negative GDPper capita was double to triple the current levels.
While seasonally adjusted unemployment is up 0.7 percentagepoints from its low of 3.5% in December 2022, it remains near record lows andless than half the rate resulting from the 1991/1992 recession. Unemployment andcredit defaults are the key indicators to watch as GDP continues to slow,interest rates remain moderate, and inflation continues to add to the cost ofliving pressure.